
2.Unlocking the Power of Data: A Deep Dive into Machine Learning Algorithms
Machine learning (ML) algorithms empower computers to learn from data, adapting and making decisions that are too complex for human-coded instructions. This exploration provides an in-depth look into several key ML algorithms, highlighting their workings, applications, and their pivotal role in the analytics landscape.
Linear Regression
How It Works: Linear Regression predicts a continuous output based on input variables. It establishes a relationship between independent (input) variables and a dependent (output) variable by fitting a linear equation to observed data. The equation's coefficients are derived during the training phase, and they then predict output values for new data.
Applications: Linear Regression is extensively used in economics for risk assessment, real estate for predicting housing prices, and business for sales forecasting. Its simplicity and interpretability make it a go-to algorithm for predictive modeling.
Value Proposition: The algorithm's strength lies in its ability to provide continuous and real-time predictions, making it indispensable for economic forecasting and trend analysis.
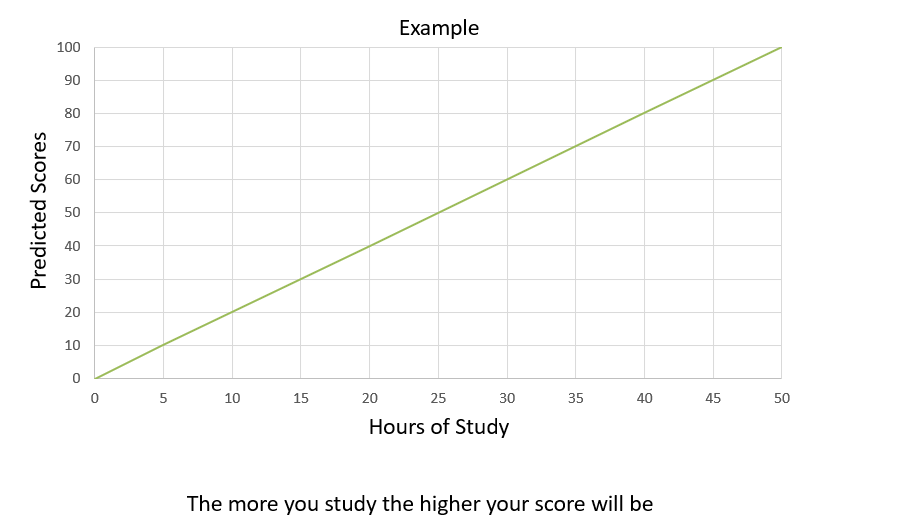
Figure 1-Linear Regression
Logistic Regression
How It Works: Despite its name suggesting a regression algorithm, Logistic Regression is used for binary classification tasks. It estimates probabilities using a logistic function, which outputs values between 0 and 1. These probabilities are then mapped to classes based on a threshold value, typically 0.5.
Applications: This algorithm is widely used in medical fields for diagnosing diseases, in marketing to predict customer churn, and in finance for credit scoring. Its ability to provide probability scores for predictions makes it invaluable for decision-making processes where uncertainty exists.
Value Proposition: Logistic Regression's ability to provide insights into the likelihood of occurrences makes it crucial for risk management and strategic planning.
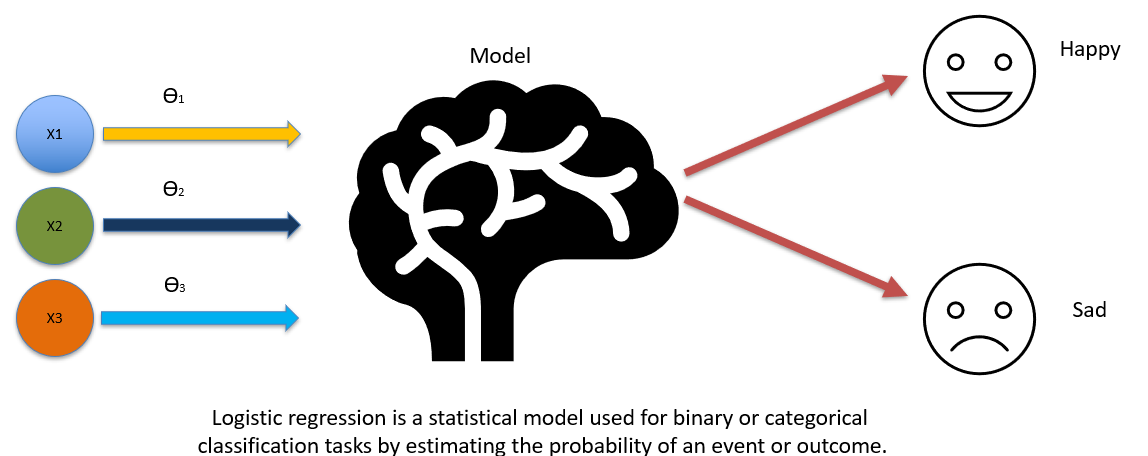
Figure 2-Logistic Regression
Decision Trees
How It Works: Decision Trees split the data into subsets using feature-based questions, creating a tree structure where leaves represent outcome decisions or classifications. This versatile algorithm can handle both numerical and categorical data.
Applications: From customer segmentation in marketing to loan approval processes in banking, Decision Trees find utility across various domains. They are instrumental in operational strategies for categorizing complex datasets into actionable insights.
Value Proposition: The algorithm's hierarchical structure offers intuitive decision-making paths, making it easier to interpret and implement in strategic planning.
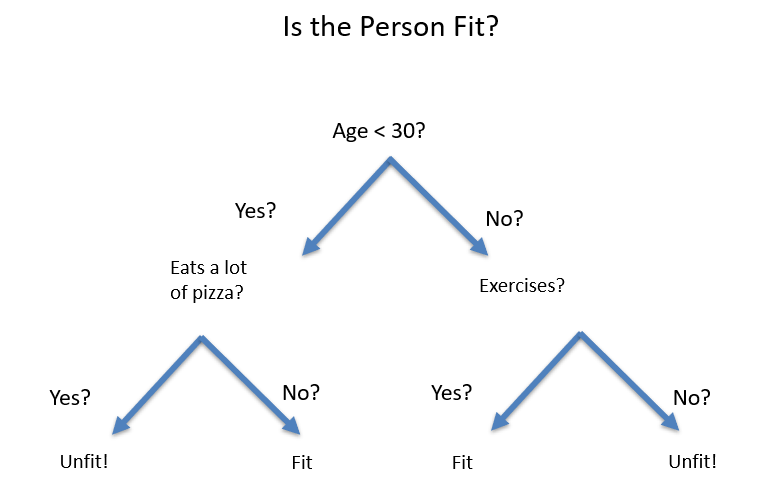
Figure 3-Decision Trees
Random Forest
How It Works: Random Forest improves upon Decision Trees by creating a forest of trees where each tree is trained on a random subset of the data. The final decision is based on the majority vote from all trees for classification tasks or the average for regression.
Applications: Random Forest is practical in bioinformatics for gene classification, e-commerce for product recommendation, and finance for stock market analysis. Its robustness against overfitting and ability to handle large datasets with high dimensionality makes it a powerful tool for predictive modeling.
Value Proposition: By aggregating decisions from multiple trees, Random Forest enhances prediction accuracy and reliability, making it essential for applications where precision is paramount.
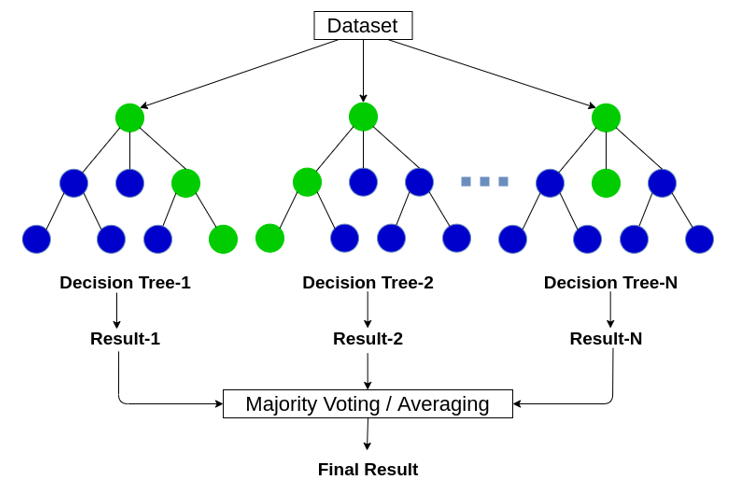
Figure 4-Random Forest
Support Vector Machines (SVM)
How It Works: SVMs classify data by finding the hyperplane that best separates different classes in the feature space. It uses kernel functions to transform data into a higher dimension where a hyperplane can separate classes linearly.
Applications: SVMs excel in image recognition and classification, text categorization, and bioinformatics for protein classification. Their ability to handle high-dimensional data and accurately perform complex classifications makes them suitable for advanced analytics tasks.
Value Proposition: SVM's strength lies in its versatility and efficiency in handling nonlinear relationships and patterns within data, enabling sophisticated data modeling and classification.
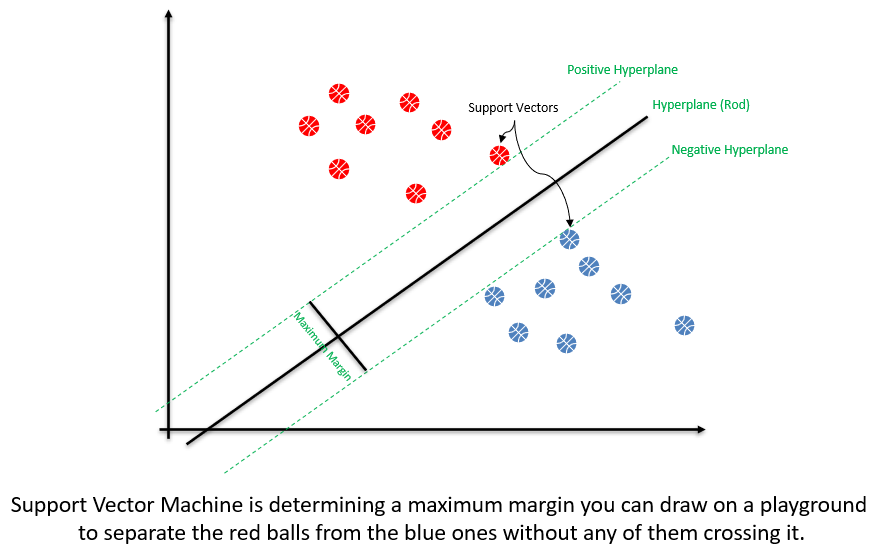
Figure 5-Support Vector Machines (SVM)
Naive Bayes
How It Works: Based on Bayes’ theorem, Naive Bayes classifiers assume independence among predictors. They calculate the probability of each class and the conditional probability of each class given an input. The class with the highest probability is considered the prediction.
Applications: Naive Bayes is predominantly used in text mining, spam filtering, and sentiment analysis. Its efficiency and speed in handling large datasets make it ideal for applications involving text or data with multiple categories.
Value Proposition: The algorithm is highly scalable and provides quick predictions, making it suitable for real-time applications and large-scale data processing.
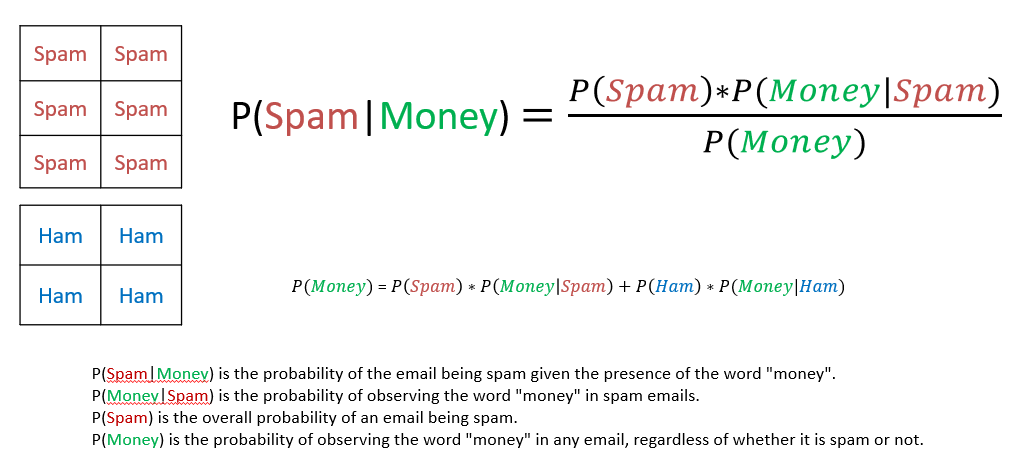
Figure 6-Naive Bayes
K-nearest Neighbors (KNN)
How It Works: KNN classifies new cases based on a similarity measure (e.g., distance functions). A data point is classified by a majority vote from its 'k' nearest neighbors. The value of 'k' is a critical parameter influencing classification accuracy.
Applications: KNN is used in recommender systems, image classification, and agriculture for crop prediction. Its simplicity and effectiveness in classification tasks make it a preferred choice for systems requiring minimal model training time.
Value Proposition: KNN's non-parametric nature makes it flexible when classifying data with complex boundaries. Its ability to adapt quickly to changes in input data is particularly beneficial for dynamic environments.
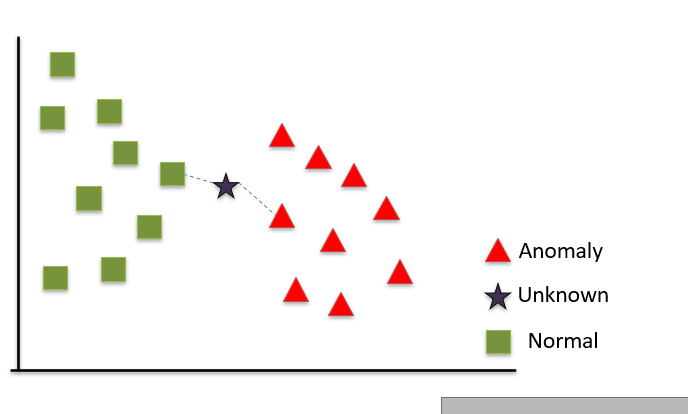
Figure 7-K-nearest Neighbors (KNN)
K-means Clustering
How It Works: An unsupervised algorithm, K-means clustering partitions 'n' observations into 'k' clusters where each observation belongs to the cluster with the nearest mean. It iteratively assigns points to the nearest cluster centroid and recomputes centroids until the assignments no longer change.
Applications: K-means is widely used in customer segmentation, data pre-processing, and pattern recognition. Its ability to uncover hidden patterns and groupings in data without predefined labels makes it powerful for exploratory data analysis.
Value Proposition: The algorithm's capacity to organize large datasets into meaningful clusters enables businesses to discover new relationships within their data, fostering innovation and strategic insights.
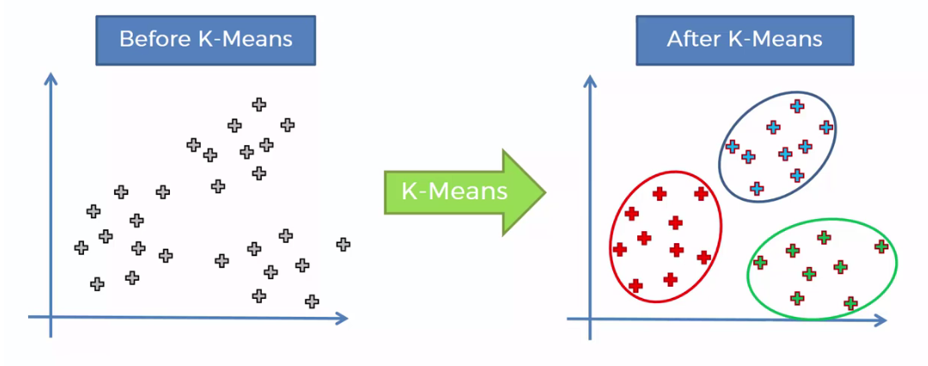
Figure 8-K-means Clustering
Machine learning algorithms, through their diverse applications and unique value propositions, are unlocking the vast potential of data across industries. As technology evolves, the depth and breadth of these algorithms' impact will continue to expand, leading to more informed decisions, optimized operations, and innovative solutions to complex challenges.
Stay tuned for our next blog, "Leveraging Machine Learning for Smart Contract Analysis," where we'll explore how advanced machine learning techniques are transforming the way we analyze, verify, and optimize smart contracts in the blockchain ecosystem. Discover AI's potential in enhancing the security, efficiency, and reliability of smart contracts, paving the way for more robust and trustworthy decentralized applications.
Brought to you by: Soroosh R&D team
Follow us on Social Media to get updates and announcements:


